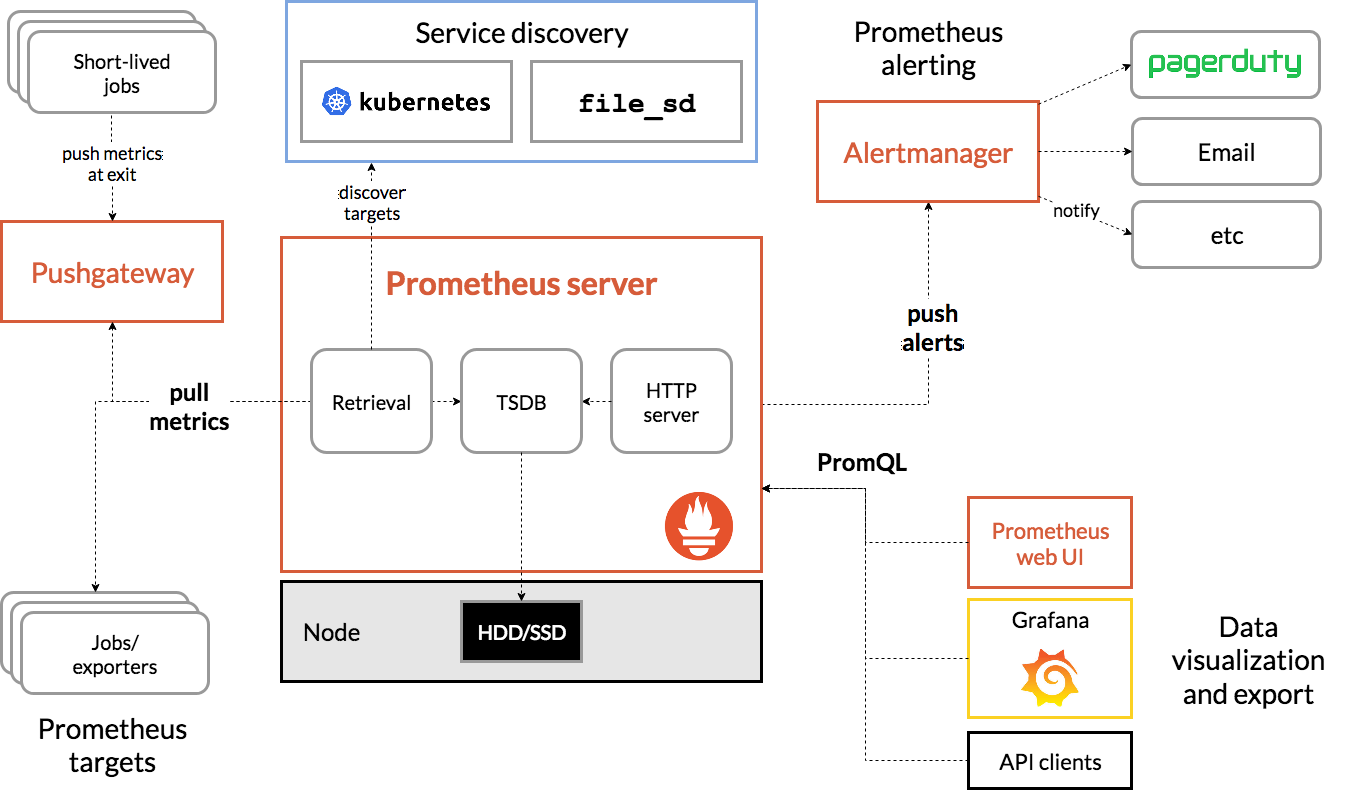
prometheus是由谷歌研发的一款开源的监控软件,它通过安装在远程机器上的exporter,通过HTTP协议从远程的机器收集数据并存储在本地的时序数据库上。
中文文档 Prometheus https://prometheus.io/docs/introduction/overview/
github:https://github.com/prometheus
1、架构基础
2、Prometheus部署与监控
Promethues部署相关软件及版本
常见部署方式
https://prometheus.io/docs/prometheus/latest/installation/
包安装
redhat 系统 https://packagecloud.io/app/prometheus-rpm/release/search
deb 系统 apt install prometheus
二进制安装 https://prometheus.io/download/
docker 安装 https://prometheus.io/docs/prometheus/latest/installation/
docker compose 安装 https://github.com/mohamadhoseinmoradi/Docker-Compose-Prometheus-andGrafana/blob/master/docker-compose.yml
Kubernetes Operator 安装 https://github.com/coreos/kube-prometheus https://github.com/prometheus-operator/kube-prometheus
2.1、包管理器安装
2.1.1、deb系
root@debian8204:~# apt list prometheus
prometheus/stable 2.53.3+ds1-2 amd64
root@debian8204:~# apt install -y prometheus
Installing:
  prometheus

Installing dependencies:
  fonts-glyphicons-halflings  libjq1                                   libjs-jquery-hotkeys   libjs-rickshaw         moreutils                 prometheus-node-exporter-collectors
  freeipmi-common             libjs-bootstrap                          libjs-moment           libjs-sizzle           node-jquery               promtool
  ipmitool                    libjs-bootstrap4                         libjs-moment-timezone  libonig5               nvme-cli                  python3-prometheus-client
  jq                          libjs-d3                                 libjs-mustache         libopenipmi0t64        openipmi                  smartmontools
  libfreeipmi17               libjs-eonasdan-bootstrap-datetimepicker  libjs-popper.js        libtime-duration-perl  prometheus-node-exporter  uuid-runtime

Suggested packages:
  freeipmi-tools  gsmartcontrol  smart-notifier  mailx  | mailutils
Created symlink '/etc/systemd/system/sockets.target.wants/uuidd.socket' → '/usr/lib/systemd/system/uuidd.socket'.
uuidd.service is a disabled or a static unit, not starting it.
ipmievd.service is a disabled or a static unit, not starting it.
Created symlink '/etc/systemd/system/default.target.wants/nvmefc-boot-connections.service' → '/usr/lib/systemd/system/nvmefc-boot-connections.service'.
Created symlink '/etc/systemd/system/default.target.wants/nvmf-autoconnect.service' → '/usr/lib/systemd/system/nvmf-autoconnect.service'.
nvmf-connect-nbft.service is a disabled or a static unit, not starting it.
nvmf-connect.target is a disabled or a static unit, not starting it.
Created symlink '/etc/systemd/system/timers.target.wants/prometheus-node-exporter-apt.timer' → '/usr/lib/systemd/system/prometheus-node-exporter-apt.timer'.
Created symlink '/etc/systemd/system/timers.target.wants/prometheus-node-exporter-ipmitool-sensor.timer' → '/usr/lib/systemd/system/prometheus-node-exporter-ipmitool-sensor.timer'.
Created symlink '/etc/systemd/system/timers.target.wants/prometheus-node-exporter-mellanox-hca-temp.timer' → '/usr/lib/systemd/system/prometheus-node-exporter-mellanox-hca-temp.timer'.
Created symlink '/etc/systemd/system/timers.target.wants/prometheus-node-exporter-nvme.timer' → '/usr/lib/systemd/system/prometheus-node-exporter-nvme.timer'.
Created symlink '/etc/systemd/system/timers.target.wants/prometheus-node-exporter-smartmon.timer' → '/usr/lib/systemd/system/prometheus-node-exporter-smartmon.timer'.
Setting up prometheus (2.53.3+ds1-2) ...
Created symlink '/etc/systemd/system/multi-user.target.wants/prometheus.service' → '/usr/lib/systemd/system/prometheus.service'.
Processing triggers for man-db (2.13.1-1) ...
Processing triggers for fontconfig (2.15.0-2.3) ...
Processing triggers for libc-bin (2.41-12) ...

# 服务安装完成之后自动配置开机启动
root@debian8204:~# systemctl status prometheus.service
● prometheus.service - Monitoring system and time series database
     Loaded: loaded (/usr/lib/systemd/system/prometheus.service; enabled; preset: enabled)
     Active: active (running) since Sat 2025-10-25 16:33:07 CST; 5min ago
 Invocation: 5bb95be946494accbd7c0ece575e780a
       Docs: https://prometheus.io/docs/introduction/overview/
             man:prometheus(1)
   Main PID: 26591 (prometheus)
      Tasks: 10 (limit: 9451)
     Memory: 38.9M (peak: 39.6M)
        CPU: 303ms
     CGroup: /system.slice/prometheus.service
             └─26591 /usr/bin/prometheus

Oct 25 16:33:07 debian8204 prometheus[26591]: ts=2025-10-25T08:33:07.831Z caller=head.go:721 level=info component=tsdb msg="Replaying WAL, this may take a while"
Oct 25 16:33:07 debian8204 prometheus[26591]: ts=2025-10-25T08:33:07.831Z caller=head.go:793 level=info component=tsdb msg="WAL segment loaded" segment=0 maxSegment=0
Oct 25 16:33:07 debian8204 prometheus[26591]: ts=2025-10-25T08:33:07.831Z caller=head.go:830 level=info component=tsdb msg="WAL replay completed" checkpoint_replay_duration=14.233µs w>
Oct 25 16:33:07 debian8204 prometheus[26591]: ts=2025-10-25T08:33:07.832Z caller=main.go:1159 level=info fs_type=EXT4_SUPER_MAGIC
Oct 25 16:33:07 debian8204 prometheus[26591]: ts=2025-10-25T08:33:07.832Z caller=main.go:1162 level=info msg="TSDB started"
Oct 25 16:33:07 debian8204 prometheus[26591]: ts=2025-10-25T08:33:07.832Z caller=main.go:1344 level=info msg="Loading configuration file" filename=/etc/prometheus/prometheus.yml
Oct 25 16:33:07 debian8204 prometheus[26591]: ts=2025-10-25T08:33:07.833Z caller=main.go:1381 level=info msg="updated GOGC" old=100 new=75
Oct 25 16:33:07 debian8204 prometheus[26591]: ts=2025-10-25T08:33:07.833Z caller=main.go:1392 level=info msg="Completed loading of configuration file" filename=/etc/prometheus/prometh>
Oct 25 16:33:07 debian8204 prometheus[26591]: ts=2025-10-25T08:33:07.833Z caller=main.go:1123 level=info msg="Server is ready to receive web requests."
Oct 25 16:33:07 debian8204 prometheus[26591]: ts=2025-10-25T08:33:07.833Z caller=manager.go:164 level=info component="rule manager" msg="Starting rule manager..."
查看service文件
root@debian8204:~# cat /usr/lib/systemd/system/prometheus.service
[Unit]
Description=Monitoring system and time series database
Documentation=https://prometheus.io/docs/introduction/overview/ man:prometheus(1)
After=time-sync.target

[Service]
Restart=on-abnormal
User=prometheus
EnvironmentFile=/etc/default/prometheus
ExecStart=/usr/bin/prometheus $ARGS
ExecReload=/bin/kill -HUP $MAINPID
TimeoutStopSec=20s
SendSIGKILL=no

# systemd hardening-options
AmbientCapabilities=
CapabilityBoundingSet=
DeviceAllow=/dev/null rw
DevicePolicy=strict
LimitMEMLOCK=0
LockPersonality=true
MemoryDenyWriteExecute=true
NoNewPrivileges=true
PrivateDevices=true
PrivateTmp=true
PrivateUsers=true
ProtectControlGroups=true
ProtectHome=true
ProtectKernelModules=true
ProtectKernelTunables=true
ProtectSystem=full
RemoveIPC=true
RestrictNamespaces=true
RestrictRealtime=true
SystemCallArchitectures=native

[Install]
WantedBy=multi-user.target
查看进程与监听端口
# 查看进程与监听端口
root@debian8204:~# ss -tlnp |grep prometheus
LISTEN 0      4096               *:9090             *:*    users:(("prometheus",pid=26591,fd=6))
LISTEN 0      4096               *:9100             *:*    users:(("prometheus-node",pid=25447,fd=3))
root@debian8204:~# ps -ef |grep prometheus
prometh+   25447       1  0 16:32 ?        00:00:00 /usr/bin/prometheus-node-exporter
prometh+   26591       1  0 16:33 ?        00:00:00 /usr/bin/prometheus
root       26654   24552  0 16:40 pts/0    00:00:00 grep prometheus
root@debian8204:~# ps -aux |grep prometheus
prometh+   25447  0.1  0.3 1614088 25920 ?       Ssl  16:32   0:00 /usr/bin/prometheus-node-exporter
prometh+   26591  0.0  1.1 1981564 90256 ?       Ssl  16:33   0:00 /usr/bin/prometheus
root       26656  0.0  0.0   6528  2284 pts/0    S+   16:40   0:00 grep prometheus
查看 /usr/bin/peometheus文件
file /usr/bin/prometheus
file命令用于确定文件的类型。它通过读取文件的“魔数”(magic number)或文件头信息来判断文件的格式。
/usr/bin/prometheus: ELF 64-bit LSB executable, x86-64, version 1 (SYSV), dynamically linked, interpreter /lib64/ld-linux-x86-64.so.2, BuildID[sha1]=3c06b10ff24ffe1da617d0373ba592316347c6d0, for GNU/Linux 3.2.0, stripped
逐项解释:
ELF 64-bit LSB executable:ELF:表示这是一个 Executable and Linkable Format 文件,是 Linux 系统上常见的可执行文件、共享库、目标文件等的标准格式。64-bit:该程序是为 64 位架构编译的。LSB:Little-Endian 字节序(低位字节在前),x86 架构使用这种字节序。
x86-64:表示该程序运行在 x86-64 架构(即 AMD64 或 Intel 64)的 CPU 上。
version 1 (SYSV):ELF 文件的版本信息,SYSV 指的是 System V ABI(Application Binary Interface)标准。
dynamically linked:表示这个可执行文件是动态链接的,意味着它在运行时需要加载外部的共享库(如 libc.so.6),而不是把所有代码都打包进可执行文件中。
interpreter /lib64/ld-linux-x86-64.so.2:这是动态链接器(也叫程序解释器)的路径。当执行这个程序时,内核会先调用这个解释器来加载所需的共享库并启动程序。
BuildID[sha1]=...:一个唯一的构建标识符(SHA1 哈希值),用于调试和识别特定版本的二进制文件。
for GNU/Linux 3.2.0:表示该程序编译时目标内核版本为 Linux 3.2.0 或更高版本。它使用了该版本内核提供的系统调用和功能。
stripped:表示这个二进制文件的符号表已被移除(通过
strip命令处理过)。这可以减小文件大小,但会使得调试困难,因为函数名、变量名等信息丢失。
✅ 总结: /usr/bin/prometheus 是一个 64 位 Linux 可执行文件,采用 ELF 格式,动态链接,适用于 x86-64 架构,编译目标为 Linux 3.2.0+ 内核,且已去除调试符号。
ldd /usr/bin/prometheus
ldd命令用于列出一个动态链接可执行文件所依赖的共享库(即.so文件)。linux-vdso.so.1 (0x00007fc1c9d56000) libc.so.6 => /lib/x86_64-linux-gnu/libc.so.6 (0x00007fc1c9b49000) /lib64/ld-linux-x86-64.so.2 (0x00007fc1c9d58000)
逐项解释:
linux-vdso.so.1:VDSO(Virtual Dynamic Shared Object)是内核提供的一段虚拟共享库,用于加速某些系统调用(如
gettimeofday)。它由内核映射到用户空间,不对应磁盘上的实际文件。地址
(0x00007fc1c9d56000)是该库在当前进程地址空间中的加载地址(每次运行可能不同)。
libc.so.6 => /lib/x86_64-linux-gnu/libc.so.6:这是程序依赖的 GNU C 库(glibc),提供了
printf,malloc,open等标准 C 函数。=>表示符号链接或实际路径。路径
/lib/x86_64-linux-gnu/libc.so.6是该库在系统中的位置。(0x00007fc1c9b49000)是该库在内存中的加载地址。
/lib64/ld-linux-x86-64.so.2:这是动态链接器本身(与
file命令中提到的 interpreter 相同)。它负责加载libc.so.6等共享库。它也会被
ldd显示出来,因为它也是运行时必需的组件。
✅ 总结: Prometheus 这个程序只直接依赖一个主要的共享库:glibc(libc.so.6)。这表明它是一个相对独立的 Go 语言编写的程序(Go 程序通常静态链接大部分库,但仍然依赖 libc 用于系统调用封装)。
radhat系安装
RHEL/Rocky/CentOS上默认没有Prometheus的仓库,可自行配置基于yum repository安装Prometheus-Server
https://packagecloud.io/app/prometheus-rpm/release/search
仓库配置
[prometheus]
name=prometheus
baseurl=https://packagecloud.io/prometheus-rpm/release/el/$releasever/$basearch
repo_gpgcheck=1
enabled=1
gpgkey=https://packagecloud.io/prometheus-rpm/release/gpgkey
https://raw.githubusercontent.com/lest/prometheus-rpm/master/RPM-GPG-KEYprometheus-rpm
gpgcheck=1
metadata_expire=300
2.2、二进制安装
2.2.1、下载源码包
官方文档 https://prometheus.io/download/
https://github.com/prometheus/prometheus/releases
下载二进制包选择LTS长期支持版
root@debian8204:/usr/local# wget https://github.com/prometheus/prometheus/releases/download/v3.5.0/prometheus-3.5.0.linux-amd64.tar.gz
root@debian8204:/usr/local# tar zxvf prometheus-3.5.0.linux-amd64.tar.gz
prometheus-3.5.0.linux-amd64/
prometheus-3.5.0.linux-amd64/prometheus.yml
prometheus-3.5.0.linux-amd64/prometheus
prometheus-3.5.0.linux-amd64/NOTICE
prometheus-3.5.0.linux-amd64/LICENSE
prometheus-3.5.0.linux-amd64/promtool
root@debian8204:/usr/local# ln -s prometheus-3.5.0.linux-amd64 prometheus
root@debian8204:/usr/local# cd prometheus
root@debian8204:/usr/local/prometheus# mkdir /usr/local/prometheus/{bin,conf,data}
root@debian8204:/usr/local/prometheus# ll
total 302948
drwxr-xr-x 2 root root        4096 Oct 25 20:38 bin
drwxr-xr-x 2 root root        4096 Oct 25 20:38 conf
drwxr-xr-x 2 root root        4096 Oct 25 20:38 data
-rw-r--r-- 1 1001 docker     11357 Jul 15 00:36 LICENSE
-rw-r--r-- 1 1001 docker      3773 Jul 15 00:36 NOTICE
-rwxr-xr-x 1 1001 docker 159425376 Jul 15 00:17 prometheus
-rw-r--r-- 1 1001 docker      1093 Jul 15 00:36 prometheus.yml
-rwxr-xr-x 1 1001 docker 150746286 Jul 15 00:17 promtool
root@debian8204:/usr/local/prometheus# mv prometheus promtool bin/
root@debian8204:/usr/local/prometheus# mv prometheus.yml conf/
# 创建prometheus用户
root@debian8204:/usr/local/prometheus# useradd -r -s /sbin/nologin prometheus
root@debian8204:/usr/local/prometheus# chown -R prometheus:prometheus /usr/local/prometheus/

# 修改环境变量
root@debian8204:/usr/local/prometheus# cat >> /etc/profile <<EOF
export PROMETHEUS_HOME=/usr/local/prometheus
export PATH=\${PROMETHEUS_HOME}/bin:\$PATH
EOF

root@debian8204:/usr/local/prometheus# source /etc/profile
查看默认配置文件
root@debian8204:/usr/local/prometheus# grep -Ev "^ *#|^$" /usr/local/prometheus/conf/prometheus.yml
global:
  scrape_interval: 15s # Set the scrape interval to every 15 seconds. Default is every 1 minute.
  evaluation_interval: 15s # Evaluate rules every 15 seconds. The default is every 1 minute.
alerting:
  alertmanagers:
    - static_configs:
        - targets:
rule_files:
scrape_configs:
  - job_name: "prometheus"
    static_configs:
      - targets: ["localhost:9090"]
        labels:
          app: "prometheus"

#属性解析:主要是global和 scrape_configs 两部分的配置,保持默认即可
检查配置文件是否正确
root@debian8204:/usr/local/prometheus# promtool check config /usr/local/prometheus/conf/prometheus.yml
Checking /usr/local/prometheus/conf/prometheus.yml
 SUCCESS: /usr/local/prometheus/conf/prometheus.yml is valid prometheus config file syntax
2.2.2创建启动service
cat > /lib/systemd/system/prometheus.service <<EOF
[Unit]
Description=Prometheus Server
Documentation=https://prometheus.io/docs/introduction/overview/
After=network.target
[Service]
Restart=on-failure
User=prometheus
Group=prometheus
WorkingDirectory=/usr/local/prometheus/
ExecStart=/usr/local/prometheus/bin/prometheus --config.file=/usr/local/prometheus/conf/prometheus.yml --web.enable-lifecycle
ExecReload=/bin/kill -HUP \$MAINPID
LimitNOFILE=65535
[Install]
WantedBy=multi-user.target
EOF

root@debian8204:/usr/local/prometheus# systemctl daemon-reload
root@debian8204:/usr/local/prometheus# systemctl enable --now prometheus.service
查看启动状态
root@debian8204:/usr/local/prometheus# systemctl status prometheus.service
● prometheus.service - Prometheus Server
     Loaded: loaded (/usr/lib/systemd/system/prometheus.service; enabled; preset: enabled)
     Active: active (running) since Sat 2025-10-25 21:18:14 CST; 6s ago
 Invocation: 9643d0fc34e24d4c8e5f9c9f1e9a32f3
       Docs: https://prometheus.io/docs/introduction/overview/
   Main PID: 28818 (prometheus)
      Tasks: 10 (limit: 9451)
     Memory: 19.2M (peak: 19.8M)
        CPU: 39ms
     CGroup: /system.slice/prometheus.service
             └─28818 /usr/local/prometheus/bin/prometheus --config.file=/usr/local/prometheus/conf/prometheus.yml --web.enable-lifecycle

Oct 25 21:18:14 debian8204 prometheus[28818]: time=2025-10-25T21:18:14.241+08:00 level=INFO source=head.go:752 msg="Replaying WAL, this may take a while" component=tsdb
Oct 25 21:18:14 debian8204 prometheus[28818]: time=2025-10-25T21:18:14.242+08:00 level=INFO source=head.go:825 msg="WAL segment loaded" component=tsdb segment=0 maxSegment=1 duration=>
Oct 25 21:18:14 debian8204 prometheus[28818]: time=2025-10-25T21:18:14.242+08:00 level=INFO source=head.go:825 msg="WAL segment loaded" component=tsdb segment=1 maxSegment=1 duration=>
Oct 25 21:18:14 debian8204 prometheus[28818]: time=2025-10-25T21:18:14.242+08:00 level=INFO source=head.go:862 msg="WAL replay completed" component=tsdb checkpoint_replay_duration=21.>
Oct 25 21:18:14 debian8204 prometheus[28818]: time=2025-10-25T21:18:14.244+08:00 level=INFO source=main.go:1309 msg="filesystem information" fs_type=EXT4_SUPER_MAGIC
Oct 25 21:18:14 debian8204 prometheus[28818]: time=2025-10-25T21:18:14.244+08:00 level=INFO source=main.go:1312 msg="TSDB started"
Oct 25 21:18:14 debian8204 prometheus[28818]: time=2025-10-25T21:18:14.244+08:00 level=INFO source=main.go:1497 msg="Loading configuration file" filename=/usr/local/prometheus/conf/pr>
Oct 25 21:18:14 debian8204 prometheus[28818]: time=2025-10-25T21:18:14.244+08:00 level=INFO source=main.go:1537 msg="Completed loading of configuration file" db_storage=524ns remote_s>
Oct 25 21:18:14 debian8204 prometheus[28818]: time=2025-10-25T21:18:14.244+08:00 level=INFO source=main.go:1273 msg="Server is ready to receive web requests."
Oct 25 21:18:14 debian8204 prometheus[28818]: time=2025-10-25T21:18:14.244+08:00 level=INFO source=manager.go:176 msg="Starting rule manager..." component="rule manager"
# 查看运行的端口号
root@debian8204:/usr/local/prometheus# ss -tlnp |grep prometheus
LISTEN 0      4096               *:9090             *:*    users:(("prometheus",pid=28818,fd=6))
查看prometheus的启动命令选项参数
root@debian8204:/usr/local/prometheus# prometheus --help
usage: prometheus [<flags>]

The Prometheus monitoring server


Flags:
  -h, --[no-]help                Show context-sensitive help (also try --help-long and --help-man).
      --[no-]version             Show application version.
      --config.file="prometheus.yml"
                                 Prometheus configuration file path.
      --config.auto-reload-interval=30s
                                 Specifies the interval for checking and automatically reloading the Prometheus configuration file upon detecting changes.
      --web.listen-address=0.0.0.0:9090 ...
                                 Address to listen on for UI, API, and telemetry. Can be repeated.
      --[no-]auto-gomaxprocs     Automatically set GOMAXPROCS to match Linux container CPU quota
      --[no-]auto-gomemlimit     Automatically set GOMEMLIMIT to match Linux container or system memory limit
      --auto-gomemlimit.ratio=0.9
                                 The ratio of reserved GOMEMLIMIT memory to the detected maximum container or system memory
      --web.config.file=""       [EXPERIMENTAL] Path to configuration file that can enable TLS or authentication.
      --web.read-timeout=5m      Maximum duration before timing out read of the request, and closing idle connections.
      --web.max-connections=512  Maximum number of simultaneous connections across all listeners.
      --web.max-notifications-subscribers=16
                                 Limits the maximum number of subscribers that can concurrently receive live notifications. If the limit is reached, new subscription requests will be
                                 denied until existing connections close.
      --web.external-url=<URL>   The URL under which Prometheus is externally reachable (for example, if Prometheus is served via a reverse proxy). Used for generating relative and
                                 absolute links back to Prometheus itself. If the URL has a path portion, it will be used to prefix all HTTP endpoints served by Prometheus. If omitted,
                                 relevant URL components will be derived automatically.
      --web.route-prefix=<path>  Prefix for the internal routes of web endpoints. Defaults to path of --web.external-url.
      --web.user-assets=<path>   Path to static asset directory, available at /user.
      --[no-]web.enable-lifecycle
                                 Enable shutdown and reload via HTTP request.
      --[no-]web.enable-admin-api
                                 Enable API endpoints for admin control actions.
      --[no-]web.enable-remote-write-receiver
                                 Enable API endpoint accepting remote write requests.
      --web.remote-write-receiver.accepted-protobuf-messages=prometheus.WriteRequest... ...
                                 List of the remote write protobuf messages to accept when receiving the remote writes. Supported values: prometheus.WriteRequest,
                                 io.prometheus.write.v2.Request
      --[no-]web.enable-otlp-receiver
                                 Enable API endpoint accepting OTLP write requests.
      --web.console.templates="consoles"
                                 Path to the console template directory, available at /consoles.
      --web.console.libraries="console_libraries"
                                 Path to the console library directory.
      --web.page-title="Prometheus Time Series Collection and Processing Server"
                                 Document title of Prometheus instance.
      --web.cors.origin=".*"     Regex for CORS origin. It is fully anchored. Example: 'https?://(domain1|domain2)\.com'
      --storage.tsdb.path="data/"
                                 Base path for metrics storage. Use with server mode only.
      --storage.tsdb.retention.time=STORAGE.TSDB.RETENTION.TIME
                                 How long to retain samples in storage. If neither this flag nor "storage.tsdb.retention.size" is set, the retention time defaults to 15d. Units
                                 Supported: y, w, d, h, m, s, ms. Use with server mode only.
      --storage.tsdb.retention.size=STORAGE.TSDB.RETENTION.SIZE
                                 Maximum number of bytes that can be stored for blocks. A unit is required, supported units: B, KB, MB, GB, TB, PB, EB. Ex: "512MB". Based on
                                 powers-of-2, so 1KB is 1024B. Use with server mode only.
      --[no-]storage.tsdb.no-lockfile
                                 Do not create lockfile in data directory. Use with server mode only.
      --storage.tsdb.head-chunks-write-queue-size=0
                                 Size of the queue through which head chunks are written to the disk to be m-mapped, 0 disables the queue completely. Experimental. Use with server mode
                                 only.
      --storage.agent.path="data-agent/"
                                 Base path for metrics storage. Use with agent mode only.
      --[no-]storage.agent.wal-compression
                                 Compress the agent WAL. If false, the --storage.agent.wal-compression-type flag is ignored. Use with agent mode only.
      --storage.agent.retention.min-time=STORAGE.AGENT.RETENTION.MIN-TIME
                                 Minimum age samples may be before being considered for deletion when the WAL is truncated Use with agent mode only.
      --storage.agent.retention.max-time=STORAGE.AGENT.RETENTION.MAX-TIME
                                 Maximum age samples may be before being forcibly deleted when the WAL is truncated Use with agent mode only.
      --[no-]storage.agent.no-lockfile
                                 Do not create lockfile in data directory. Use with agent mode only.
      --storage.remote.flush-deadline=<duration>
                                 How long to wait flushing sample on shutdown or config reload.
      --storage.remote.read-sample-limit=5e7
                                 Maximum overall number of samples to return via the remote read interface, in a single query. 0 means no limit. This limit is ignored for streamed
                                 response types. Use with server mode only.
      --storage.remote.read-concurrent-limit=10
                                 Maximum number of concurrent remote read calls. 0 means no limit. Use with server mode only.
      --storage.remote.read-max-bytes-in-frame=1048576
                                 Maximum number of bytes in a single frame for streaming remote read response types before marshalling. Note that client might have limit on frame size
                                 as well. 1MB as recommended by protobuf by default. Use with server mode only.
      --rules.alert.for-outage-tolerance=1h
                                 Max time to tolerate prometheus outage for restoring "for" state of alert. Use with server mode only.
      --rules.alert.for-grace-period=10m
                                 Minimum duration between alert and restored "for" state. This is maintained only for alerts with configured "for" time greater than grace period.
                                 Use with server mode only.
      --rules.alert.resend-delay=1m
                                 Minimum amount of time to wait before resending an alert to Alertmanager. Use with server mode only.
      --rules.max-concurrent-evals=4
                                 Global concurrency limit for independent rules that can run concurrently. When set, "query.max-concurrency" may need to be adjusted accordingly.
                                 Use with server mode only.
      --alertmanager.notification-queue-capacity=10000
                                 The capacity of the queue for pending Alertmanager notifications. Use with server mode only.
      --alertmanager.notification-batch-size=256
                                 The maximum number of notifications per batch to send to the Alertmanager. Use with server mode only.
      --[no-]alertmanager.drain-notification-queue-on-shutdown
                                 Send any outstanding Alertmanager notifications when shutting down. If false, any outstanding Alertmanager notifications will be dropped when shutting
                                 down. Use with server mode only.
      --query.lookback-delta=5m  The maximum lookback duration for retrieving metrics during expression evaluations and federation. Use with server mode only.
      --query.timeout=2m         Maximum time a query may take before being aborted. Use with server mode only.
      --query.max-concurrency=20
                                 Maximum number of queries executed concurrently. Use with server mode only.
      --query.max-samples=50000000
                                 Maximum number of samples a single query can load into memory. Note that queries will fail if they try to load more samples than this into memory,
                                 so this also limits the number of samples a query can return. Use with server mode only.
      --enable-feature= ...      Comma separated feature names to enable. Valid options: exemplar-storage, expand-external-labels, memory-snapshot-on-shutdown,
                                 promql-per-step-stats, promql-experimental-functions, extra-scrape-metrics, auto-gomaxprocs, native-histograms, created-timestamp-zero-ingestion,
                                 concurrent-rule-eval, delayed-compaction, old-ui, otlp-deltatocumulative, promql-duration-expr, use-uncached-io. See
                                 https://prometheus.io/docs/prometheus/latest/feature_flags/ for more details.
      --[no-]agent               Run Prometheus in 'Agent mode'.
      --log.level=info           Only log messages with the given severity or above. One of: [debug, info, warn, error]
      --log.format=logfmt        Output format of log messages. One of: [logfmt, json]
2.3、docker安装
2.3.1 docker run命令启动容器
Prometheus 数据存储在容器内的 /prometheus 目录中,因此每次容器重新启动时数据都会被清除。 要保存您的数据,您需要为您的容器设置持久存储(或绑定挂载)。
运行带有持久存储的 Prometheus 容器
# Create persistent volume for your data
docker volume create prometheus-data
# Start Prometheus container
docker run \
    -p 9090:9090 \
    -v /path/to/prometheus.yml:/etc/prometheus/prometheus.yml \
    -v prometheus-data:/prometheus \
    prom/prometheus
2.3.1 docker compose 启动容器
volumes:
  prometheus_data: {}
networks:
  monitoring:
    driver: bridge
services:
  prometheus:
    image: prom/prometheus
    volumes:
      - ./prometheus/:/etc/prometheus/
      - prometheus_data:/prometheus
    command:
      - '--config.file=/etc/prometheus/prometheus.yml'
      - '--storage.tsdb.path=/prometheus'
      - '--web.console.libraries=/usr/share/prometheus/console_libraries'
      - '--web.console.templates=/usr/share/prometheus/consoles'
      - '--web.enable-lifecycle'
   networks:
    - monitoring
   ports:
    - 9090:9090
   restart: always
2.4、k8s集群安装
2.5 配置文件说明
Prometheus可以通过命令行或者配置文件的方式对服务进行配置
命令行方式一般用于不可变的系统参数配置,例如存储位置、要保留在磁盘和内存中的数据量等;配置文件用于定义与数据动态获取相关的配置选项和文件等内容。
命令行方式的配置属性可以通过 prometheus -h 的方式来获取,这些配置属性主要在服务启动时候设置.
配置文件方式,需要在prometheus.yml 文件中修改配置属性,该配置文件的内容是以YAML格式编写的。
官方文档:https://prometheus.io/docs/prometheus/latest/configuration/configuration/
默认情况下,Prometheus 的配置文件有四部分组成
global:
  scrape_interval: 15s # Set the scrape interval to every 15 seconds. Default is every 1 minute.
  evaluation_interval: 15s # Evaluate rules every 15 seconds. The default is every 1 minute.
alerting:
  alertmanagers:
    - static_configs:
        - targets:
rule_files:
scrape_configs:
  - job_name: "prometheus"
    static_configs:
      - targets: ["localhost:9090"]
        labels:
          app: "prometheus"
配置解析
#核心配置:
global #全局配置内容
alerting #触发告警相关的配置,主要是与Alertmanager相关的设置。
rule_files #各种各样的外置规则文件配置,包含了各种告警表达式、数据查询表达式等
scrape_configs #监控项的配置列表,这是最核心的配置
#除了默认的四项配置之外,prometheus还有另外可选的其它配置如下
#扩展配置(8项)
tls_config、static_config、relabel_config、metric_relabel_configs、
alert_relabel_configs、alertmanager_config、remote_write、remote_read
#平台集成配置(12项)
azure_sd_config、consul_sd_config、dns_sd_config、ec2_sd_config、
openstack_sd_config、file_sd_config、gce_sd_config、kubernetes_sd_config、
marathon_sd_config、nerve_sd_config、serverset_sd_config、triton_sd_config
scrape_configs 是操作最多的一个配置段,它指定了一组监控目标及其细节配置参数,这些目标和参数描述了如何获取指定主机上的时序数据。配置样例如下:
scrape_configs:
  - job_name: '<job_name>'
    static_configs:
       - targets: [ '<host_ip:host_port>', ... ]
         labels: { <labelname>: <labelvalue> ... }
#配置解析:
#在一般情况下,一个scrape_configs配置需要指定一个或者多个job,根据我们之前对基本概念的了解,
每一个job都是一系列的instance集合,借助job我们可以将目标主机进行分组管理。
#对于job内部的每一个instance的配置,都需要借助于static_configs参数获取目标列表,只要在该列表
位置的目标,都可以被Prometheus动态服务自动发现。
#static_configs可以借助于 targets 以ip+port 方式发现目标,也可以使用labels以标签方式发现
目标。
2.6 node_exporter安装
安装 Node Exporter 用于收集各 node 主机节点上的监控指标数据,监听端口为9100
GitHub链接:https://github.com/prometheus/node_exporter
官方下载:https://prometheus.io/download/
2.6.1、下载源码包
root@debian8204:/usr/local# wget -P /usr/local/ https://github.com/prometheus/node_exporter/releases/download/v1.9.1/node_exporter-1.9.1.linux-amd64.tar.gz
root@debian8204:/usr/local# tar zxvf node_exporter-1.9.1.linux-amd64.tar.gz
root@debian8204:/usr/local/node_exporter# mkdir -p bin/
root@debian8204:/usr/local/node_exporter# mv node_exporter bin/

# 创建prometheus用户,并授权文件夹
root@debian8204:/usr/local/node_exporter# useradd -r -s /sbin/nologin prometheus
root@debian8204:/usr/local/node_exporter# chown -R prometheus:prometheus /usr/local/node_exporter/
2.6.2、创建启动service
cat > /lib/systemd/system/node_exporter.service <<EOF
[Unit]
Description=Prometheus Node Exporter
After=network.target
[Service]
Type=simple
ExecStart=/usr/local/node_exporter/bin/node_exporter --collector.zoneinfo
ExecReload=/bin/kill -HUP $MAINPID
Restart=on-failure
User=prometheus
Group=prometheus
[Install]
WantedBy=multi-user.target
EOF

root@debian8204:/usr/local/node_exporter# systemctl daemon-reload
root@debian8204:/usr/local/node_exporter# systemctl enable --now node_exporter.service
查看启动状态
root@debian8204:/usr/local/node_exporter# systemctl status node_exporter.service
● node_exporter.service - Prometheus Node Exporter
     Loaded: loaded (/usr/lib/systemd/system/node_exporter.service; enabled; preset: enabled)
     Active: active (running) since Sat 2025-10-25 22:18:06 CST; 33s ago
 Invocation: 7d96c1b48d184e1eb09ca9fa1c5b86e1
   Main PID: 29054 (node_exporter)
      Tasks: 6 (limit: 9451)
     Memory: 5.1M (peak: 5.4M)
        CPU: 7ms
     CGroup: /system.slice/node_exporter.service
             └─29054 /usr/local/node_exporter/bin/node_exporter --collector.zoneinfo

Oct 25 22:18:06 debian8204 node_exporter[29054]: time=2025-10-25T14:18:06.186Z level=INFO source=node_exporter.go:141 msg=timex
Oct 25 22:18:06 debian8204 node_exporter[29054]: time=2025-10-25T14:18:06.186Z level=INFO source=node_exporter.go:141 msg=udp_queues
Oct 25 22:18:06 debian8204 node_exporter[29054]: time=2025-10-25T14:18:06.186Z level=INFO source=node_exporter.go:141 msg=uname
Oct 25 22:18:06 debian8204 node_exporter[29054]: time=2025-10-25T14:18:06.186Z level=INFO source=node_exporter.go:141 msg=vmstat
Oct 25 22:18:06 debian8204 node_exporter[29054]: time=2025-10-25T14:18:06.186Z level=INFO source=node_exporter.go:141 msg=watchdog
Oct 25 22:18:06 debian8204 node_exporter[29054]: time=2025-10-25T14:18:06.186Z level=INFO source=node_exporter.go:141 msg=xfs
Oct 25 22:18:06 debian8204 node_exporter[29054]: time=2025-10-25T14:18:06.186Z level=INFO source=node_exporter.go:141 msg=zfs
Oct 25 22:18:06 debian8204 node_exporter[29054]: time=2025-10-25T14:18:06.186Z level=INFO source=node_exporter.go:141 msg=zoneinfo
Oct 25 22:18:06 debian8204 node_exporter[29054]: time=2025-10-25T14:18:06.186Z level=INFO source=tls_config.go:347 msg="Listening on" address=[::]:9100
Oct 25 22:18:06 debian8204 node_exporter[29054]: time=2025-10-25T14:18:06.186Z level=INFO source=tls_config.go:350 msg="TLS is disabled." http2=false address=[::]:9100

root@debian8204:/usr/local/node_exporter# ss -tlunp |grep node_exporter
tcp   LISTEN 0      4096               *:9100             *:*    users:(("node_exporter",pid=29054,fd=3))
查看node_exporter的启动命令选项参数
#启用:--collector.<name>
#禁用:--no-collector.<name>

root@debian8204:/usr/local/node_exporter# ./bin/node_exporter --help
usage: node_exporter [<flags>]


Flags:
  -h, --[no-]help                Show context-sensitive help (also try --help-long and --help-man).
      --collector.arp.device-include=COLLECTOR.ARP.DEVICE-INCLUDE
                                 Regexp of arp devices to include (mutually exclusive to device-exclude).
      --collector.arp.device-exclude=COLLECTOR.ARP.DEVICE-EXCLUDE
                                 Regexp of arp devices to exclude (mutually exclusive to device-include).
      --[no-]collector.arp.netlink
                                 Use netlink to gather stats instead of /proc/net/arp.
      --[no-]collector.bcache.priorityStats
                                 Expose expensive priority stats.
      --[no-]collector.cpu.guest
                                 Enables metric node_cpu_guest_seconds_total
      --[no-]collector.cpu.info  Enables metric cpu_info
      --collector.cpu.info.flags-include=COLLECTOR.CPU.INFO.FLAGS-INCLUDE
                                 Filter the `flags` field in cpuInfo with a value that must be a regular expression
      --collector.cpu.info.bugs-include=COLLECTOR.CPU.INFO.BUGS-INCLUDE
                                 Filter the `bugs` field in cpuInfo with a value that must be a regular expression
      --collector.diskstats.device-exclude="^(z?ram|loop|fd|(h|s|v|xv)d[a-z]|nvme\\d+n\\d+p)\\d+$"
                                 Regexp of diskstats devices to exclude (mutually exclusive to device-include).
      --collector.diskstats.device-include=COLLECTOR.DISKSTATS.DEVICE-INCLUDE
                                 Regexp of diskstats devices to include (mutually exclusive to device-exclude).
      --collector.ethtool.device-include=COLLECTOR.ETHTOOL.DEVICE-INCLUDE
                                 Regexp of ethtool devices to include (mutually exclusive to device-exclude).
      --collector.ethtool.device-exclude=COLLECTOR.ETHTOOL.DEVICE-EXCLUDE
                                 Regexp of ethtool devices to exclude (mutually exclusive to device-include).
      --collector.ethtool.metrics-include=".*"
                                 Regexp of ethtool stats to include.
      --collector.filesystem.mount-points-exclude="^/(dev|proc|run/credentials/.+|sys|var/lib/docker/.+|var/lib/containers/storage/.+)($|/)"
                                 Regexp of mount points to exclude for filesystem collector. (mutually exclusive to mount-points-include)
      --collector.filesystem.mount-points-include=COLLECTOR.FILESYSTEM.MOUNT-POINTS-INCLUDE
                                 Regexp of mount points to include for filesystem collector. (mutually exclusive to mount-points-exclude)
      --collector.filesystem.fs-types-exclude="^(autofs|binfmt_misc|bpf|cgroup2?|configfs|debugfs|devpts|devtmpfs|fusectl|hugetlbfs|iso9660|mqueue|nsfs|overlay|proc|procfs|pstore|rpc_pipefs|securityfs|selinuxfs|squashfs|sysfs|tracefs)$"
                                 Regexp of filesystem types to exclude for filesystem collector. (mutually exclusive to fs-types-include)
      --collector.filesystem.fs-types-include=COLLECTOR.FILESYSTEM.FS-TYPES-INCLUDE
                                 Regexp of filesystem types to exclude for filesystem collector. (mutually exclusive to fs-types-exclude)
      --collector.hwmon.chip-include=COLLECTOR.HWMON.CHIP-INCLUDE
                                 Regexp of hwmon chip to include (mutually exclusive to device-exclude).
      --collector.hwmon.chip-exclude=COLLECTOR.HWMON.CHIP-EXCLUDE
                                 Regexp of hwmon chip to exclude (mutually exclusive to device-include).
      --collector.hwmon.sensor-include=COLLECTOR.HWMON.SENSOR-INCLUDE
                                 Regexp of hwmon sensor to include (mutually exclusive to sensor-exclude).
      --collector.hwmon.sensor-exclude=COLLECTOR.HWMON.SENSOR-EXCLUDE
                                 Regexp of hwmon sensor to exclude (mutually exclusive to sensor-include).
      --collector.interrupts.name-include=COLLECTOR.INTERRUPTS.NAME-INCLUDE
                                 Regexp of interrupts name to include (mutually exclusive to --collector.interrupts.name-exclude).
      --collector.interrupts.name-exclude=COLLECTOR.INTERRUPTS.NAME-EXCLUDE
                                 Regexp of interrupts name to exclude (mutually exclusive to --collector.interrupts.name-include).
      --[no-]collector.interrupts.include-zeros
                                 Include interrupts that have a zero value
      --collector.ipvs.backend-labels="local_address,local_port,remote_address,remote_port,proto,local_mark"
                                 Comma separated list for IPVS backend stats labels.
      --collector.netclass.ignored-devices="^$"
                                 Regexp of net devices to ignore for netclass collector.
      --[no-]collector.netclass.ignore-invalid-speed
                                 Ignore devices where the speed is invalid. This will be the default behavior in 2.x.
      --[no-]collector.netclass.netlink
                                 Use netlink to gather stats instead of /proc/net/dev.
      --[no-]collector.netclass_rtnl.with-stats
                                 Expose the statistics for each network device, replacing netdev collector.
      --collector.netdev.device-include=COLLECTOR.NETDEV.DEVICE-INCLUDE
                                 Regexp of net devices to include (mutually exclusive to device-exclude).
      --collector.netdev.device-exclude=COLLECTOR.NETDEV.DEVICE-EXCLUDE
                                 Regexp of net devices to exclude (mutually exclusive to device-include).
      --[no-]collector.netdev.address-info
                                 Collect address-info for every device
      --[no-]collector.netdev.enable-detailed-metrics
                                 Use (incompatible) metric names that provide more detailed stats on Linux
      --[no-]collector.netdev.netlink
                                 Use netlink to gather stats instead of /proc/net/dev.
      --[no-]collector.netdev.label-ifalias
                                 Add ifAlias label
      --collector.netstat.fields="^(.*_(InErrors|InErrs)|Ip_Forwarding|Ip(6|Ext)_(InOctets|OutOctets)|Icmp6?_(InMsgs|OutMsgs)|TcpExt_(Listen.*|Syncookies.*|TCPSynRetrans|TCPTimeouts|TCPOFOQueue|TCPRcvQDrop)|Tcp_(ActiveOpens|InSegs|OutSegs|OutRsts|PassiveOpens|RetransSegs|CurrEstab)|Udp6?_(InDatagrams|OutDatagrams|NoPorts|RcvbufErrors|SndbufErrors))$"
                                 Regexp of fields to return for netstat collector.
      --collector.ntp.server="127.0.0.1"
                                 NTP server to use for ntp collector
      --collector.ntp.server-port=123
                                 UDP port number to connect to on NTP server
      --collector.ntp.protocol-version=4
                                 NTP protocol version
      --[no-]collector.ntp.server-is-local
                                 Certify that collector.ntp.server address is not a public ntp server
      --collector.ntp.ip-ttl=1   IP TTL to use while sending NTP query
      --collector.ntp.max-distance=3.46608s
                                 Max accumulated distance to the root
      --collector.ntp.local-offset-tolerance=1ms
                                 Offset between local clock and local ntpd time to tolerate
      --path.procfs="/proc"      procfs mountpoint.
      --path.sysfs="/sys"        sysfs mountpoint.
      --path.rootfs="/"          rootfs mountpoint.
      --path.udev.data="/run/udev/data"
                                 udev data path.
      --collector.perf.cpus=""   List of CPUs from which perf metrics should be collected
      --collector.perf.tracepoint=COLLECTOR.PERF.TRACEPOINT ...
                                 perf tracepoint that should be collected
      --[no-]collector.perf.disable-hardware-profilers
                                 disable perf hardware profilers
      --collector.perf.hardware-profilers=COLLECTOR.PERF.HARDWARE-PROFILERS ...
                                 perf hardware profilers that should be collected
      --[no-]collector.perf.disable-software-profilers
                                 disable perf software profilers
      --collector.perf.software-profilers=COLLECTOR.PERF.SOFTWARE-PROFILERS ...
                                 perf software profilers that should be collected
      --[no-]collector.perf.disable-cache-profilers
                                 disable perf cache profilers
      --collector.perf.cache-profilers=COLLECTOR.PERF.CACHE-PROFILERS ...
                                 perf cache profilers that should be collected
      --collector.powersupply.ignored-supplies="^$"
                                 Regexp of power supplies to ignore for powersupplyclass collector.
      --collector.qdisc.fixtures=""
                                 test fixtures to use for qdisc collector end-to-end testing
      --collector.qdisc.device-include=COLLECTOR.QDISC.DEVICE-INCLUDE
                                 Regexp of qdisc devices to include (mutually exclusive to device-exclude).
      --collector.qdisc.device-exclude=COLLECTOR.QDISC.DEVICE-EXCLUDE
                                 Regexp of qdisc devices to exclude (mutually exclusive to device-include).
      --[no-]collector.rapl.enable-zone-label
                                 Enables service unit metric unit_start_time_seconds
      --collector.runit.servicedir="/etc/service"
                                 Path to runit service directory.
      --collector.slabinfo.slabs-include=".*"
                                 Regexp of slabs to include in slabinfo collector.
      --collector.slabinfo.slabs-exclude=""
                                 Regexp of slabs to exclude in slabinfo collector.
      --[no-]collector.stat.softirq
                                 Export softirq calls per vector
      --collector.supervisord.url="http://localhost:9001/RPC2"
                                 XML RPC endpoint. ($SUPERVISORD_URL)
      --collector.sysctl.include=COLLECTOR.SYSCTL.INCLUDE ...
                                 Select sysctl metrics to include
      --collector.sysctl.include-info=COLLECTOR.SYSCTL.INCLUDE-INFO ...
                                 Select sysctl metrics to include as info metrics
      --collector.systemd.unit-include=".+"
                                 Regexp of systemd units to include. Units must both match include and not match exclude to be included.
      --collector.systemd.unit-exclude=".+\\.(automount|device|mount|scope|slice)"
                                 Regexp of systemd units to exclude. Units must both match include and not match exclude to be included.
      --[no-]collector.systemd.enable-task-metrics
                                 Enables service unit tasks metrics unit_tasks_current and unit_tasks_max
      --[no-]collector.systemd.enable-restarts-metrics
                                 Enables service unit metric service_restart_total
      --[no-]collector.systemd.enable-start-time-metrics
                                 Enables service unit metric unit_start_time_seconds
      --collector.tapestats.ignored-devices="^$"
                                 Regexp of devices to ignore for tapestats.
      --collector.textfile.directory= ...
                                 Directory to read text files with metrics from, supports glob matching. (repeatable)
      --collector.vmstat.fields="^(oom_kill|pgpg|pswp|pg.*fault).*"
                                 Regexp of fields to return for vmstat collector.
      --collector.wifi.fixtures=""
                                 test fixtures to use for wifi collector metrics
      --[no-]collector.arp       Enable the arp collector (default: enabled).
      --[no-]collector.bcache    Enable the bcache collector (default: enabled).
      --[no-]collector.bonding   Enable the bonding collector (default: enabled).
      --[no-]collector.btrfs     Enable the btrfs collector (default: enabled).
      --[no-]collector.buddyinfo
                                 Enable the buddyinfo collector (default: disabled).
      --[no-]collector.cgroups   Enable the cgroups collector (default: disabled).
      --[no-]collector.conntrack
                                 Enable the conntrack collector (default: enabled).
      --[no-]collector.cpu       Enable the cpu collector (default: enabled).
      --[no-]collector.cpu_vulnerabilities
                                 Enable the cpu_vulnerabilities collector (default: disabled).
      --[no-]collector.cpufreq   Enable the cpufreq collector (default: enabled).
      --[no-]collector.diskstats
                                 Enable the diskstats collector (default: enabled).
      --[no-]collector.dmi       Enable the dmi collector (default: enabled).
      --[no-]collector.drbd      Enable the drbd collector (default: disabled).
      --[no-]collector.drm       Enable the drm collector (default: disabled).
      --[no-]collector.edac      Enable the edac collector (default: enabled).
      --[no-]collector.entropy   Enable the entropy collector (default: enabled).
      --[no-]collector.ethtool   Enable the ethtool collector (default: disabled).
      --[no-]collector.fibrechannel
                                 Enable the fibrechannel collector (default: enabled).
      --[no-]collector.filefd    Enable the filefd collector (default: enabled).
      --[no-]collector.filesystem
                                 Enable the filesystem collector (default: enabled).
      --[no-]collector.hwmon     Enable the hwmon collector (default: enabled).
      --[no-]collector.infiniband
                                 Enable the infiniband collector (default: enabled).
      --[no-]collector.interrupts
                                 Enable the interrupts collector (default: disabled).
      --[no-]collector.ipvs      Enable the ipvs collector (default: enabled).
      --[no-]collector.ksmd      Enable the ksmd collector (default: disabled).
      --[no-]collector.lnstat    Enable the lnstat collector (default: disabled).
      --[no-]collector.loadavg   Enable the loadavg collector (default: enabled).
      --[no-]collector.logind    Enable the logind collector (default: disabled).
      --[no-]collector.mdadm     Enable the mdadm collector (default: enabled).
      --[no-]collector.meminfo   Enable the meminfo collector (default: enabled).
      --[no-]collector.meminfo_numa
                                 Enable the meminfo_numa collector (default: disabled).
      --[no-]collector.mountstats
                                 Enable the mountstats collector (default: disabled).
      --[no-]collector.netclass  Enable the netclass collector (default: enabled).
      --[no-]collector.netdev    Enable the netdev collector (default: enabled).
      --[no-]collector.netstat   Enable the netstat collector (default: enabled).
      --[no-]collector.network_route
                                 Enable the network_route collector (default: disabled).
      --[no-]collector.nfs       Enable the nfs collector (default: enabled).
      --[no-]collector.nfsd      Enable the nfsd collector (default: enabled).
      --[no-]collector.ntp       Enable the ntp collector (default: disabled).
      --[no-]collector.nvme      Enable the nvme collector (default: enabled).
      --[no-]collector.os        Enable the os collector (default: enabled).
      --[no-]collector.perf      Enable the perf collector (default: disabled).
      --[no-]collector.powersupplyclass
                                 Enable the powersupplyclass collector (default: enabled).
      --[no-]collector.pressure  Enable the pressure collector (default: enabled).
      --[no-]collector.processes
                                 Enable the processes collector (default: disabled).
      --[no-]collector.qdisc     Enable the qdisc collector (default: disabled).
      --[no-]collector.rapl      Enable the rapl collector (default: enabled).
      --[no-]collector.runit     Enable the runit collector (default: disabled).
      --[no-]collector.schedstat
                                 Enable the schedstat collector (default: enabled).
      --[no-]collector.selinux   Enable the selinux collector (default: enabled).
      --[no-]collector.slabinfo  Enable the slabinfo collector (default: disabled).
      --[no-]collector.sockstat  Enable the sockstat collector (default: enabled).
      --[no-]collector.softirqs  Enable the softirqs collector (default: disabled).
      --[no-]collector.softnet   Enable the softnet collector (default: enabled).
      --[no-]collector.stat      Enable the stat collector (default: enabled).
      --[no-]collector.supervisord
                                 Enable the supervisord collector (default: disabled).
      --[no-]collector.sysctl    Enable the sysctl collector (default: disabled).
      --[no-]collector.systemd   Enable the systemd collector (default: disabled).
      --[no-]collector.tapestats
                                 Enable the tapestats collector (default: enabled).
      --[no-]collector.tcpstat   Enable the tcpstat collector (default: disabled).
      --[no-]collector.textfile  Enable the textfile collector (default: enabled).
      --[no-]collector.thermal_zone
                                 Enable the thermal_zone collector (default: enabled).
      --[no-]collector.time      Enable the time collector (default: enabled).
      --[no-]collector.timex     Enable the timex collector (default: enabled).
      --[no-]collector.udp_queues
                                 Enable the udp_queues collector (default: enabled).
      --[no-]collector.uname     Enable the uname collector (default: enabled).
      --[no-]collector.vmstat    Enable the vmstat collector (default: enabled).
      --[no-]collector.watchdog  Enable the watchdog collector (default: enabled).
      --[no-]collector.wifi      Enable the wifi collector (default: disabled).
      --[no-]collector.xfrm      Enable the xfrm collector (default: disabled).
      --[no-]collector.xfs       Enable the xfs collector (default: enabled).
      --[no-]collector.zfs       Enable the zfs collector (default: enabled).
      --[no-]collector.zoneinfo  Enable the zoneinfo collector (default: disabled).
      --web.telemetry-path="/metrics"
                                 Path under which to expose metrics.
      --[no-]web.disable-exporter-metrics
                                 Exclude metrics about the exporter itself (promhttp_*, process_*, go_*).
      --web.max-requests=40      Maximum number of parallel scrape requests. Use 0 to disable.
      --[no-]collector.disable-defaults
                                 Set all collectors to disabled by default.
      --runtime.gomaxprocs=1     The target number of CPUs Go will run on (GOMAXPROCS) ($GOMAXPROCS)
      --[no-]web.systemd-socket  Use systemd socket activation listeners instead of port listeners (Linux only).
      --web.listen-address=:9100 ...
                                 Addresses on which to expose metrics and web interface. Repeatable for multiple addresses. Examples: `:9100` or `[::1]:9100` for http, `vsock://:9100`
                                 for vsock
      --web.config.file=""       Path to configuration file that can enable TLS or authentication. See:
                                 https://github.com/prometheus/exporter-toolkit/blob/master/docs/web-configuration.md
      --log.level=info           Only log messages with the given severity or above. One of: [debug, info, warn, error]
      --log.format=logfmt        Output format of log messages. One of: [logfmt, json]
      --[no-]version             Show application version.
2.6.3 docker容器化启动
docker run命令启动
您想要监控的任何非 root 挂载点都需要绑定挂载到容器中。
如果您要启动用于主机监控的容器,请指定 path.rootfs 参数。此参数必须与主机根的绑定挂载路径匹配。node_exporter 将使用 path.rootfs 作为前缀来访问主机文件系统。
docker run -d \
  --net="host" \
  --pid="host" \
  -v "/:/host:ro,rslave" \
  quay.io/prometheus/node-exporter:latest \
  --path.rootfs=/host
docker compose 启动
---
version: '3.8'

services:
  node_exporter:
    image: quay.io/prometheus/node-exporter:latest
    container_name: node_exporter
    command:
      - '--path.rootfs=/host'
    network_mode: host
    pid: host
    restart: unless-stopped
    volumes:
      - '/:/host:ro,rslave'
networks:
monitoring:
driver: bridge
services:
node-exporter:
image: prom/node-exporter:v1.4.0
volumes:
- /proc:/host/proc:ro
- /sys:/host/sys:ro
- /:/rootfs:ro
command:
- '--path.procfs=/host/proc'
- '--path.sysfs=/host/sys'
- '--collector.filesystem.mount-points-exclude=^/(sys|proc|dev|host|etc)($$|/)'
- '--path.rootfs=/host'
ports:
- 9100:9100
networks:
- monitoring
restart: always2.6.4、k8s集群配置
kubernetes 集群中部署Node-exporter
apiVersion: apps/v1
kind: DaemonSet
metadata:
  name: daemonset-demo
  namespace: default
  labels:
    app: prometheus
    component: node-exporter
spec:
  selector:
    matchLabels:
      app: prometheus
      component: node-exporter
  template:
    metadata:
      name: prometheus-node-exporter
      labels:
        app: prometheus
        component: node-exporter
    spec:
      #tolerations:
      #- key: node-role.kubernetes.io/control-plane
      # operator: Exists
      # effect: NoSchedule
      #- key: node-role.kubernetes.io/master
      # operator: Exists
      # effect: NoSchedule
      volumes:
        - name: proc
          hostPath:范例:kubernetes 部署Node-exporter并集成 Prometheus自动发现
            path: /proc
        - name: sys
          hostPath:
            path: /sys
        - name: rootfs
          hostPath:
            path: /
      containers:
         - image: prom/node-exporter:v1.2.2
           name: prometheus-node-exporter
           args:
           - --path.procfs=/host/proc
           - --path.sys=/host/sys
           - --path.rootfs=/host
           volumeMounts:
           - mountPath: /host/proc
             name: proc
           - mountPath: /host/sys
             name: sys
           - mountPath: /host
             name: rootfs
           ports:
           - name: prom-node-exp
             containerPort: 9100
             hostPort: 9100
           livenessProbe:
             tcpSocket:
               port: prom-node-exp
             initialDelaySeconds: 3
           readinessProbe:
             httpGet:
               path: '/metrics'
               port: prom-node-exp
               scheme: HTTP
             initialDelaySeconds: 5
      hostNetwork: true
      hostPID: true
kubernetes 部署Node-exporter并集成 Prometheus自动发现
cat yaml/node-exporter-ds.yaml

apiVersion: apps/v1
kind: DaemonSet
metadata:
  name: prometheus-node-exporter
  namespace: prom
  labels:
    app: prometheus
    component: node-exporter
spec:
  selector:
     matchLabels:
       app: prometheus
       component: node-exporter
  template:
    metadata:
       name: prometheus-node-exporter
       labels:
         app: prometheus
         component: node-exporter
    spec:
      tolerations:
      - effect: NoSchedule
        key: node-role.kubernetes.io/master
      containers:
      - image: prom/node-exporter:v1.5.0
        name: prometheus-node-exporter
      ports:
      - name: prom-node-exp
        containerPort: 9100
        hostPort: 9100
      hostNetwork: true
      hostPID: true

cat yaml/node-exporter-svc.yaml

apiVersion: v1
kind: Service
metadata:
  annotations:
    prometheus.io/scrape: 'true' #配置由kubernetes自动发现加入prometheus的target中
  name: prometheus-node-exporter
  namespace: prom
  labels:
    app: prometheus
    component: node-exporter
spec:
  clusterIP: None
  ports:
  - name: prometheus-node-exporter
    port: 9100
    protocol: TCP
  selector:
    app: prometheus
    component: node-exporter
  type: ClusterIP
2.6.5 Node_exporter常用指标
node_boot_time:系统自启动以后的总计时间
node_cpu:系统CPU使用量
node_disk*:磁盘IO
node_filesystem*:系统文件系统用量
node_load1:系统CPU负载
node_memeory*:内存使用量
node_network*:网络带宽指标
node_time:当前系统时间
go_*:node exporter中go相关指标
process_*:node exporter自身进程相关运行指标
2.6.6、Prometheus 采集 Node Exporter 数据
修改 Prometheus 配置文件
global:
  scrape_interval: 15s # Set the scrape interval to every 15 seconds. Default is every 1 minute.
  evaluation_interval: 15s # Evaluate rules every 15 seconds. The default is every 1 minute.
alerting:
  alertmanagers:
    - static_configs:
        - targets:
rule_files:
scrape_configs:
  - job_name: "prometheus"
    static_configs:
      - targets: ["localhost:9090"]
        labels:
          app: "prometheus"
# 添加node_exporter的相关配置
  - job_name: "node_exporter"
    static_configs:
      - targets: ["192.168.8.71:9100"]
        labels:
          app: "node01_exporter"
      - targets: ["192.168.8.72:9100"]
        labels:
          app: "node02_exporter"
      - targets: ["192.168.8.73:9100"]
        labels:
          app: "node03_exporter"

#属性解析:
#新增一个job_name 和 static_configs的属性
#每一个 target 即前面基本提到的实例 instance,格式就是"ip:port"